

RESEARCH & PERSPECTIVES
The cost of
being heard.
Evidence, history and careful comparisons on access to justice.

A long history, without a false single cause
| Civilisation / period | Institutional lens | What the comparison cannot prove |
|---|---|---|
| Egypt / antiquity | Ma’at links judgment with truth and cosmic balance. | A moral ideal is not evidence of equal treatment in practice. |
| Greece / sixth century BCE | Solon’s reforms addressed debt and political conflict in Athens. | No comparable legal-fees-to-GDP dataset is available here. |
| India / ancient statecraft | The Arthashastra connects governance, resources and welfare; its dating is debated. | Ancient statecraft cannot be converted into a modern legal-cost index. |
| China / Tang era | Codification and imperial institutions show the role of law in a complex state. | Dynastic change cannot be explained by legal fees alone. |
| United States / modern era | Constitutional institutions coexist with documented civil legal-help gaps. | An access gap does not establish a date of societal collapse. |
| Malaysia / present | Multiple legal and regulatory settings increase the value of accessible explanations. | US or European statistics are not Malaysian measurements. |
Sources / further reading: Ma’at: ancient Egyptian balance · Solon and Athenian reform · Arthashastra: governance and welfare · Tang Dynasty historical overview · United States Constitution
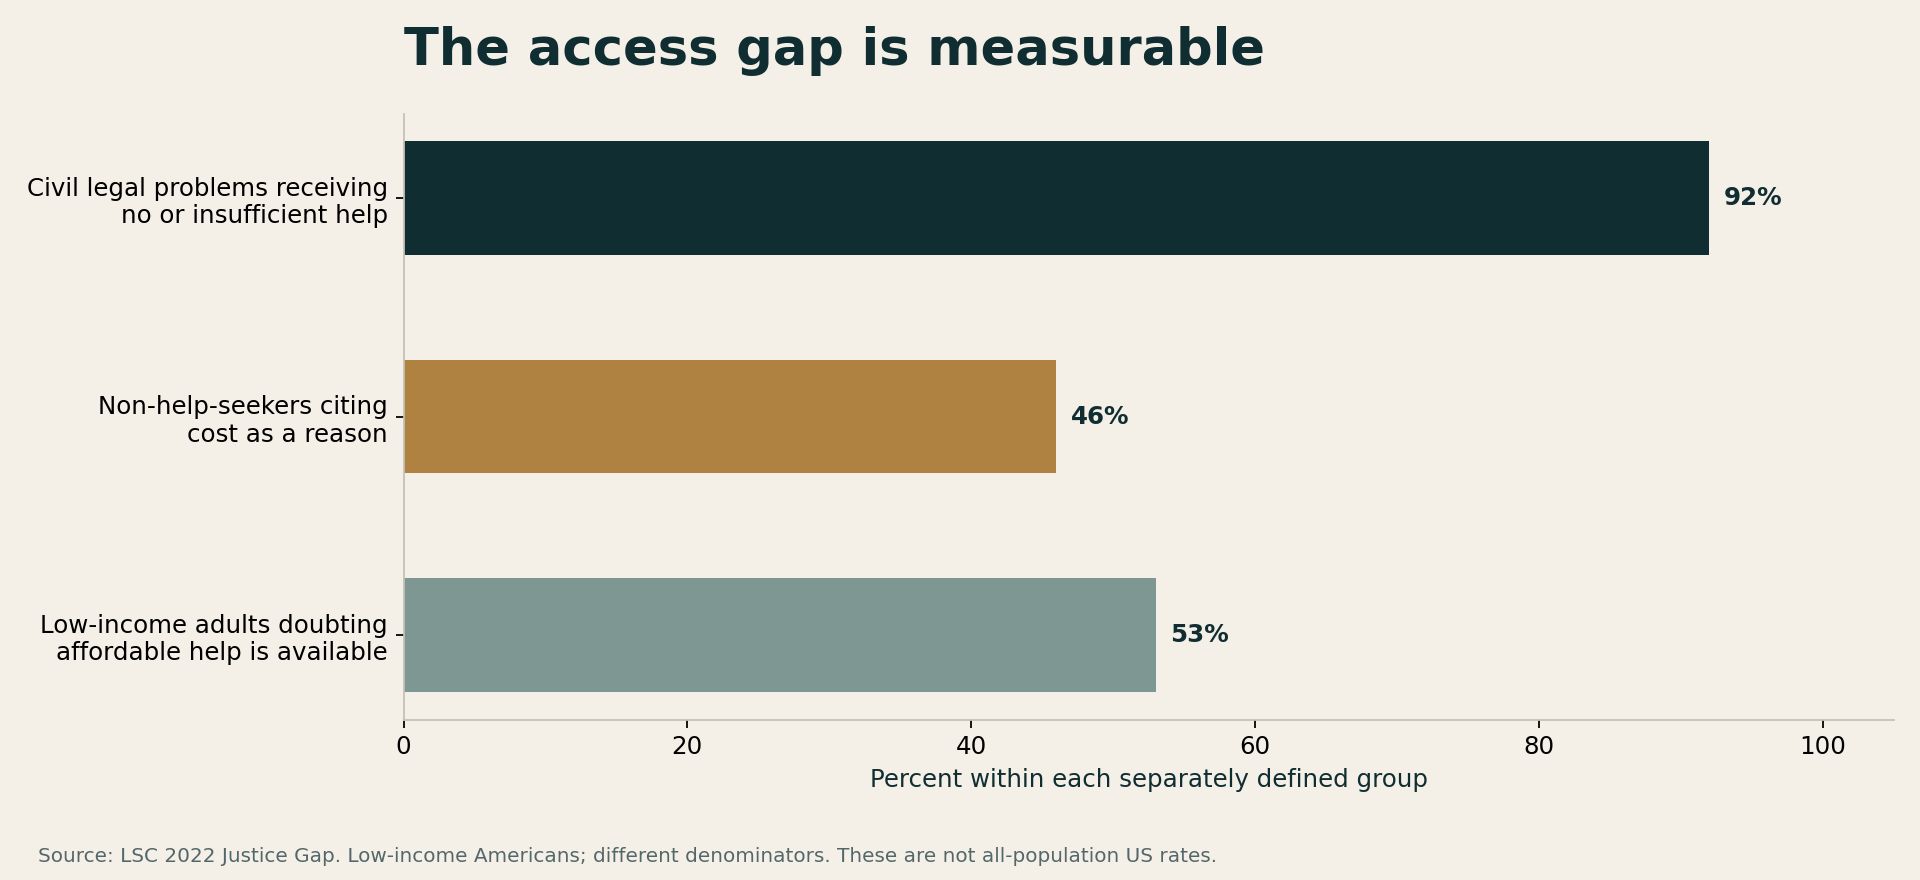
The LSC’s 2022 study identifies a substantial US civil-justice gap among low-income people. The bars describe different groups and must not be added together or generalised to all Americans.
Sources / further reading: LSC 2022 Justice Gap study
Public expenditure is not a lawyer’s bill
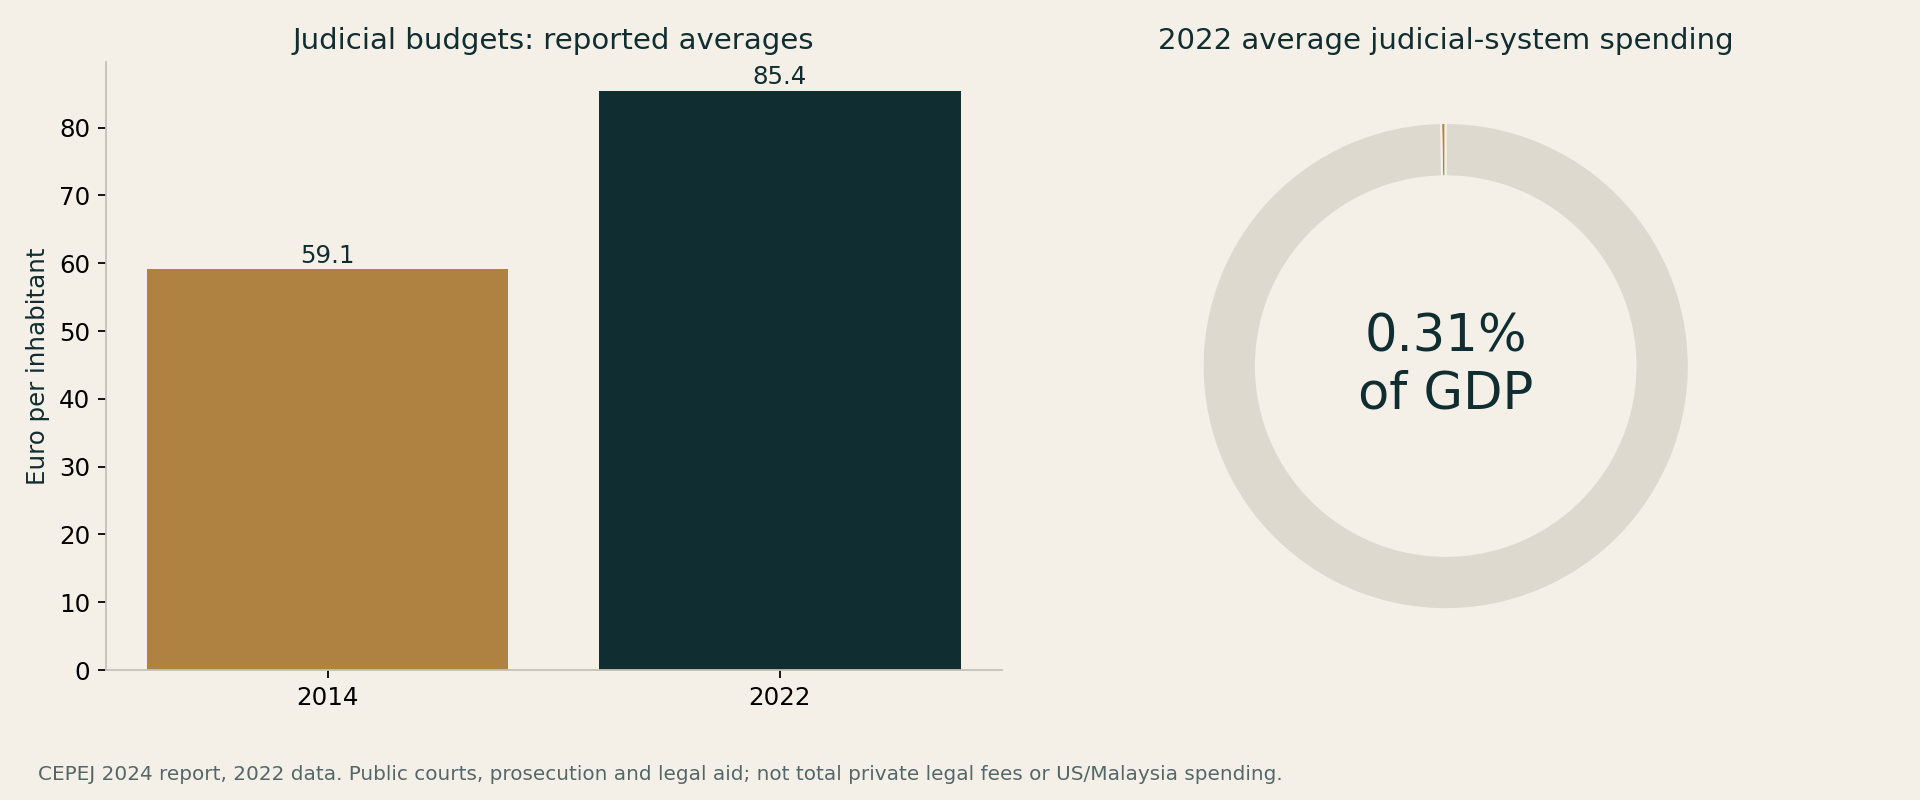
CEPEJ reports average European judicial-system spending of €85.4 per inhabitant and 0.31% of GDP in 2022. The measure covers courts, prosecution and legal aid. It is not total private legal spending, and the per-person figures are not inflation-adjusted here.
Sources / further reading: CEPEJ 2024 report: 2022 data
What a cost burden means for a household
| Illustrative matter cost | Annual household income RM60,000 | Annual household income RM240,000 |
|---|---|---|
| RM3,000 | 5% | 1.25% |
| RM15,000 | 25% | 6.25% |
| RM60,000 | 100% | 25% |
Arithmetic examples only; these are not Malaysian fee quotes, typical fees, income estimates or predictions. Legal bills vary by work, forum, complexity, tax and disbursements. Request an itemised scope and estimate.
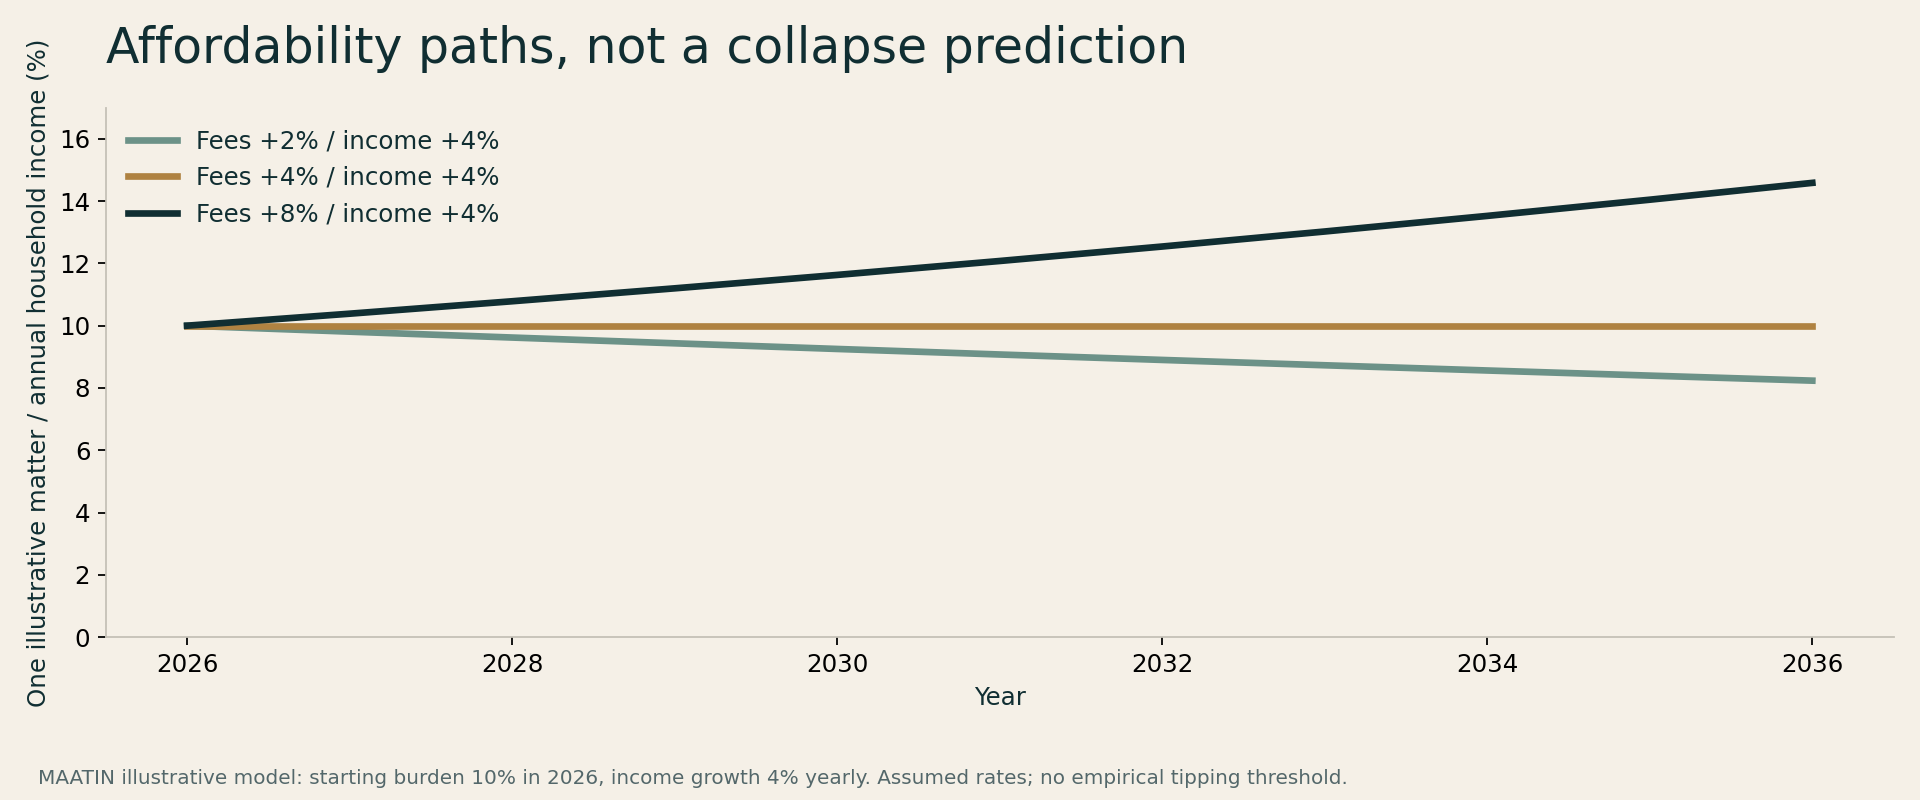
The model starts with a hypothetical matter costing 10% of annual income. Burden in year t = 10% × [(1 + fee growth) / (1 + income growth)]^(t − 2026). It can illustrate a US or Malaysian household scenario but estimates neither country. A “tipping point” would require a defined outcome, longitudinal evidence and validated causal analysis; none is claimed.
The Malaysia question
Our editorial view is that access should not depend on wealth or connections. We have not established that only a single-digit elite can afford Malaysian justice, nor that the Malaysian economy is collapsing. A useful local study would measure quoted fees, household resources, legal-aid eligibility, unmet needs, resolution time and outcomes—with transparent sampling.
Why China belongs in the business lens
The WTO profile reports China’s share of world merchandise exports at 14.42% and imports at 10.58% for 2022. These are different flows, not a combined share of all global trade, and not a claim about 2026. They support the practical importance of understanding Chinese counterparties without assuming every business must trade with China.
Sources / further reading: WTO China trade profile: 2022 data
Research standards
- Separate reported measurements, editorial interpretation and assumptions.
- Link the original source and state the data year.
- Do not rank individual judges, predict guilt or publish unsupported wrongdoing claims.
- Correct errors visibly and invite reproducible research.

